Synovial sarcoma (SS) represents approximately 10 % of all soft tissue sarcomas and typically occurs in adolescent and young adult patients. SS is divided into two basic histological subgroups: biphasic and monophasic SS. Biphasic SS is composed of epithelial cells arranged into glandular structures and spindle cells whilst monophasic SS composes only spindle-cellular component.
Synovial sarcoma is characterized by a specific translocation t(X;18) resulting in the fusion of the gene SYT (18q11) and one of related genes SSX1 (Xp11.23) or SSX2 (Xp11.21). Chimeric transcript SYT-SSX likely deregulates the transcription of certain important genes.
SYT-SSX fusion transcript represents a very sensitive and specific marker of synovial sarcomas, plus there is a correlation between the type of fusion transcript SYT-SSX and histological subtype of SS. In biphasic SS we mostly found translocation SYT-SSX1 whilst monophasic SS carry mostly SYT-SSX2 translocation.
Examination
The presence of the translocation t(X;18) or the SYT gene disruption is analyzed by RT-PCR and FISH.
RT-PCR
When RT-PRC, we isolate mRNA and after its transcription into cDNA we detect chimeric transcripts using PCR with universal primers and primers specific for both individual types of fusion. PCR products are vizualized through agarose gel electrophoresis.
Figure 1 shows detection using universal primers: 1 to 5 - positive samples, 6 - negative samples, 7 - positive control, 8 - negative control, 9 - water.
Figure 2 shows detection of universal fusion partner: 2, 3, 6, 7 - positive samples with SYT/SSX2 fusion, 4 - positive sample with fusion SYT/SSX1, 1 and 8 - negative samples, 9 - negative control, 10 - water. The specificity of products is verified by sequencing (fig. 3).
FISH
When FISH, we detect the break of the gene SYT using SYT Dual Color, Break Apart Rearrangement Probe, Vysis/Abbot (this probe does not identify the specific translocation partner). In a sample positive for rearrangement of the gene SYT we observe one yellow, one red and one green signal (fig. 4a). In negative samples we observe two yellow signals (fig. 4b).
-
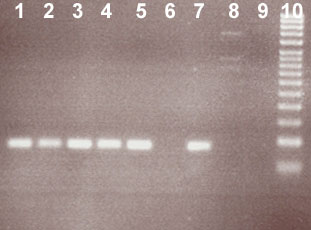 Fig.1
Fig.1t(X;18) detection by RT-PCR using universal primers - photo of agarose gel. Wells 1 to 5 - positive samples, 6 - negative samples, 7 - positive control, 8 - negative control, 9 - water.
-
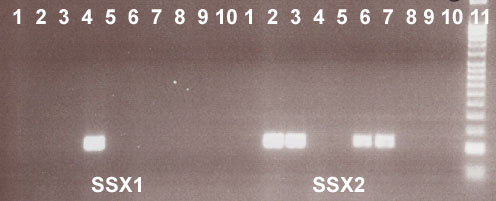 Fig.2
Fig.2Detection of specific fusion partner of the gene SYT when t(X;18) by RT-PCR - photo of agarose gel. Wells 2, 3, 6, 7 - positive samples with SYT/SSX2 fusion, 4 - positive sample with SYT/SSX1 fusion, 1 and 8 - negative samples, 9 - negative control, 10 - water.
-
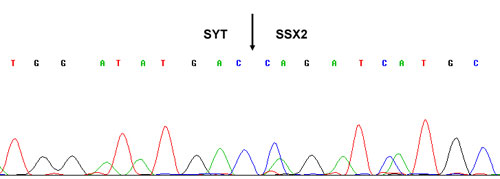 Fig.3
Fig.3Outcome of sequencing with a labeled point of the SYT and SSX2 gene fusion.
-
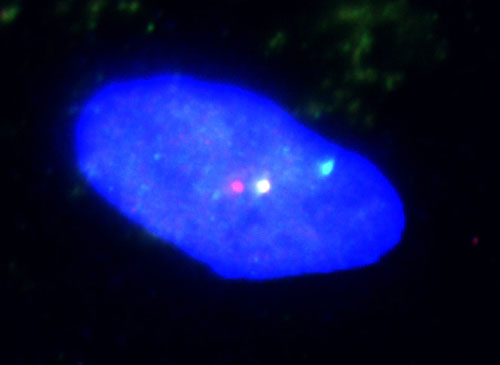 Fig.4a
Detection of the translocation t(X;18) using FISH.
a) positive -
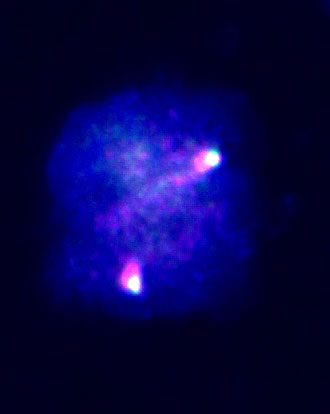 Fig.4b
Detection of the translocation t(X;18) using FISH.
b) negative
References
- O'Sullivan MJ, Kyriakos M, Zhu X, Wick MR, Swanson PE, Dehner LP, Humphrey PA,Pfeifer JD.Malignant peripheral nerve sheath tumors with t(X;18). A pathologic and molecular genetic study.Mod Pathol. 2000 Dec;13(12):1336-46.